SQL Server Monitoring

Stop suffering with
generic alerts
for SQL Server

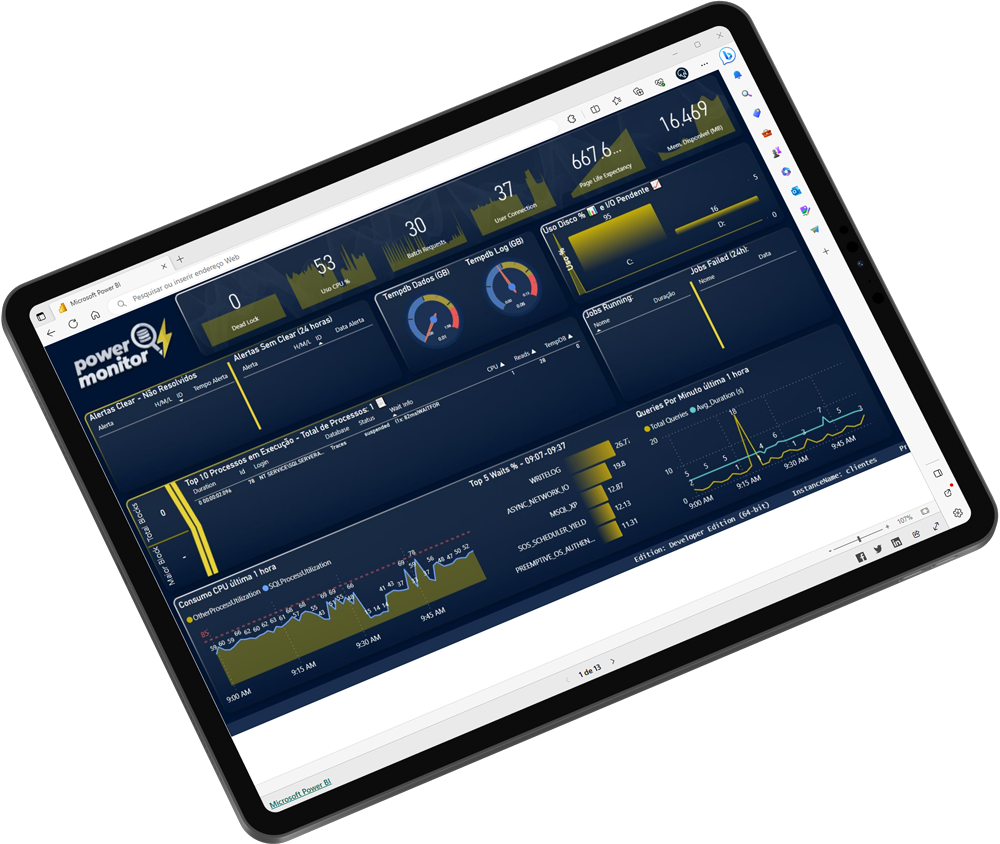
Get notified before a problem becomes a crisis. Power Alerts monitors dozens of critical metrics and sends rich alerts with contextual charts and clear explanations.

0 Alerts created
0 DBA routines
30 Days free
Power Alerts Dashboard on tablet
Critical alert detected ⚠ Log Full — PROD_DB

Alert sent to DBA in <1 min

0
Active clients
0
Monitored instances
13,000+
Monitored databases
30
Days free trial
The Product

A robust tool built by
experienced DBAs

Power Alerts monitors dozens of critical metrics — log, performance, integrity, backups, blocking and much more — sending rich, contextual alerts with charts.

Sample Power Alerts email with charts and diagnostics

No more hunting through logs and generic systems

Power Alerts tells you exactly what's wrong, so you can act fast and confidently — no need to log into the server to investigate.

📊

Contextual Charts

Each alert includes historical charts — last 60 minutes and last 48 hours — right in the email.

🔍

Diagnosis Inside the Email

The first things a DBA would investigate are already pre-digested and included in every alert.

Productivity and Cost Savings

Fewer hours investigating, more time resolving. Real savings in DBA hours ($).

🔒

INPI Registered Product

Registration nº 512022002100-5 — intellectual property protected by Power Tuning.

Environments

SQL Server compatible with
any infrastructure

Microsoft SQL Server

On-Premises

SQL Server

Azure Virtual Machine

Cloud (VM)

Azure Virtual Machine

Azure SQL Managed Instance

Azure Managed Instance

Azure SQL Managed Instance

Amazon RDS

Amazon RDS (AWS)

Amazon RDS

Azure SQL Database

Azure SQL Database

Coming soon

Our Clients

Dashboard with clients who already
receive Power Alerts

Power Monitor is a Power BI dashboard created by our BI team to monitor our clients' SQL Server databases in real time.

Power Monitor requires a Power BI account, a Data Gateway with access to the traces database, and the ability to install non-listed AppSource apps.

Talk to Specialists
Full Coverage

Over 40 alerts
ready from day one

From the first day of use, Power Alerts is already monitoring all critical metrics in your SQL Server environment.

Critical

Alerts requiring immediate action: Log Full, Disk Space, DB Without Backup, Page Corruption…

Warning

Preventive alerts: CPU High, Slow Queries, Index Fragmentation, Memory Available…

Informational

Continuous monitoring: AlwaysOn AG Health, Failover Cluster, SQL Server Config…

Log Full
Blocked Process
Blocked Long Process
Disk Space
DB Without Backup
Page Corruption
Database Corruption
SQL Server Restarted
IO Pending
Database Status
CPU Utilization
Slow Queries
Large LDF File
Tempdb MDF Utilization
Memory Available
Database Growth
Index Fragmentation
Slow File Growth
Long Running Process
Rebuild Failed
Identity Values
DeadLock
Slow Disk
MaxSize Growth
Login Failed
Database Errors
DB Without Log Backup
DB Without Full Backup
New Ignored DB
Server Needs Hotfix
CheckDB Databases
SQL Server Connection
Alert Without Clear
Database Created
Job Failed
Job Disabled or Deleted
Update Statistics
Traces Size
AlwaysOn AG Health
Failover Cluster Status
Double Check Alert
Int-Bigint Limit
Daily DB CheckList
PowerAlert Timeout

Free trial for 30 days!

Get in touch with our Specialists and see the monitoring evolution in action.

Real Example

See a Log FULL alert in action

Each alert contains all the information a DBA would need to manually gather — already compiled, right in the email.

1 Log File Information
2 Disk Space
3 Last Log Backup
4 Log Used by Session ID
5 Running Processes in the Database
6 Alert Charts
Log Full alert header in Power Alerts

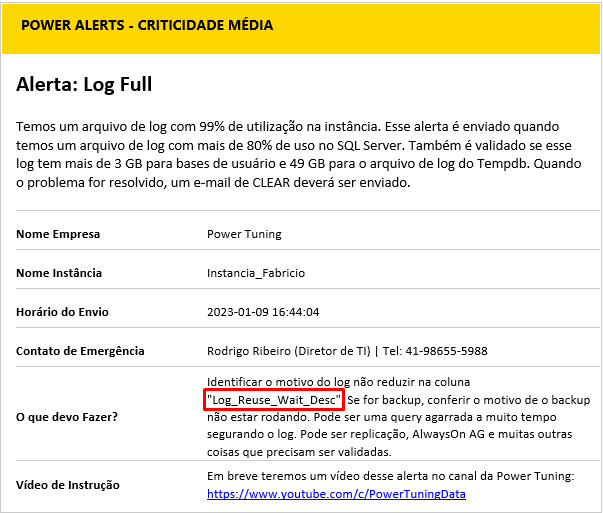
Real Log Full alert header received by the DBA

Beyond Alerts

Over 25 DBA routines
created automatically

Power Alerts installs routines that store historical data and help DBAs monitor and act with much greater efficiency.

01

Deadlock Monitoring

02

Script Errors in Databases

03

Highest Waits Over Time Intervals

04

Statistics Status

05

Queries Using TempDB

06

TempDB Data File Growth

07

SQL Server Counters

08

Slowest Queries in Environment

09

Memory Usage

10

Login Failures

11

Whoisactive Every 1 Minute

12

Database Log File Growth

13

Job History

14

Index Usage

15

Table and Database Growth

16

Index Fragmentation

17

Identity Columns Near Overflow

18

I/O Pending Queue

19

Data and Log File Response Times

20

SQL Server Error Log

21

Disk Space

22

CPU Usage and Heaviest Queries

23

CheckDB Execution

24

Backup History

25

Cluster, Mirror and AlwaysOn AG Monitoring

26

Automatic Old Data Cleanup

Power Monitor

Power BI Dashboard
for your data

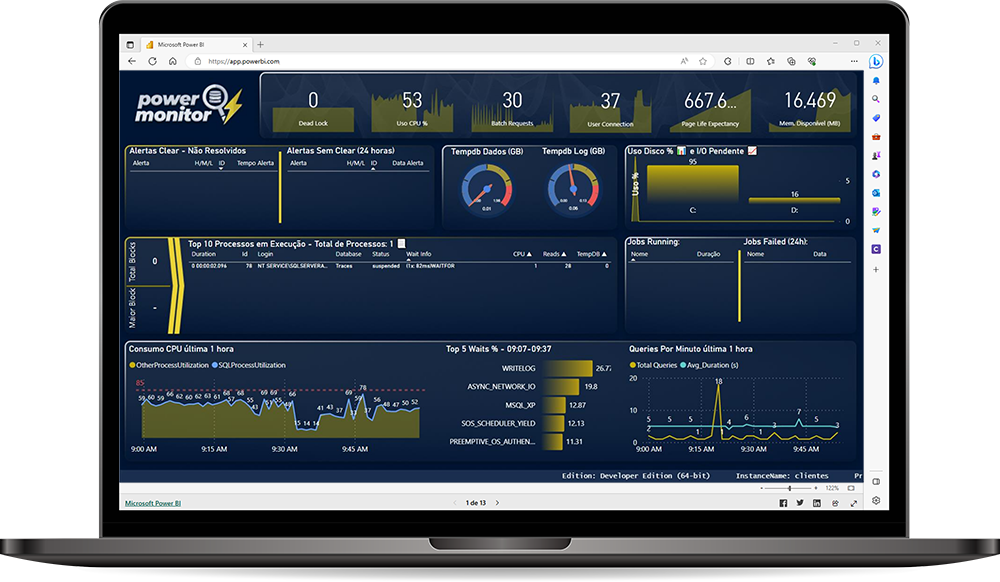
Using data stored by Power Alerts routines, our BI team built a Power BI dashboard to help monitor your database environment.

Power BI account
Data gateway with access to the traces database
Permission to install apps not listed on AppSource
See Power Monitor
Power Monitor — Power BI Dashboard
Power Reports — Client Dashboard
Power Reports

Complete analysis with
a single SQL command

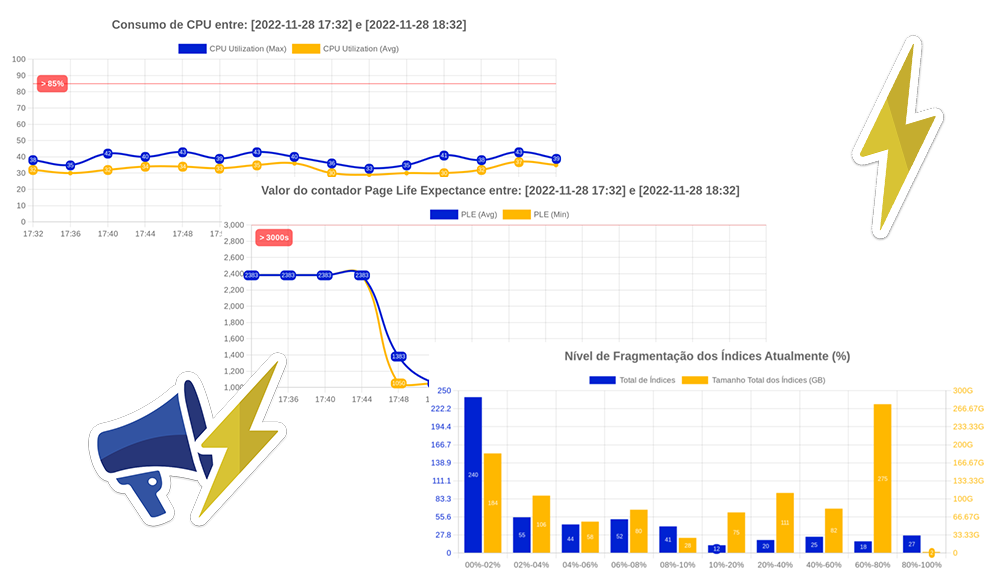
Reporting stored procedures that send dozens of charts to your email in less than 5 minutes.

Example — Environment performance between two dates:

EXEC [dbo].[stpPowerReport_SQL_Performance]
    @Dt_Start = '2024-11-27 18:00',
    @Dt_End   = '2024-11-28 18:00',
    @Ds_Email = '[email protected]'
🖥️

CPU
Information

🧠

Memory PLE
Counter

🔌

SQL Server
Connections

📋

Whoisactive
Log Queries

🔢

Pending
I/O Counter

💾

Available
Physical Memory

⏱️

Queries
over 3 seconds

📈

TempDB
Growth

🔍

Slowest
Queries

🔄

Slowest
Jobs

🏋️

Biggest SQL
Server Waits

📊

Other
Power Reports

Testimonials

What our customers say

Growth

Numbers that prove
our track record

Since launch, Power Alerts has grown consistently. See how our main indicators have evolved over time.

Total Clients
32
2022
147
2023
185
2024
203
2025
206
2026*
Monitored Instances
59
2022
297
2023
393
2024
490
2025
513
2026*
Monitored Databases
1,455
2022
6,611
2023
9,625
2024
13,746
2025
13,024
2026*

* Data as of April 2026

Pricing

Per-instance pricing,
no surprises

Licensed per instance. The more instances, the lower the price per each.

1 to 4 instances
Starter
$ 40 /mo per instance
$384/year per instance (billed annually)
All 40+ alerts included
25+ monitoring routines
Daily checklist and monthly email
Power Reports
Power Tuning team support
Get Started
10 to 19 instances
Enterprise
$ 20 /mo per instance
$192/year per instance (billed annually)
Everything in Professional
Best volume discount
Differentiated SLA
Monthly executive report
Dedicated account manager
Talk to a Specialist

📌 Important Details

Implementation: One-time fee of $240 per instance for installation, configuration and initial monitoring setup.

Power Tuning clients already have benefits:

  • Monitoring contract with Power Tuning: no additional cost for Power Alerts.
  • 24×7 DBA on-call contract: 50% discount on Power Alerts.

Above 20 instances, contact us for a custom proposal.

⚠️ What is not included in this proposal

Technical improvement actions in the environment after Alert implementation:

  • Full Disk
  • Log Full
  • Database without Backup
  • Slow Environment
  • Other common day-to-day DBA issues

Deployment of heavy Administration routines:

  • Index maintenance, statistics update, and CheckDB routines will not be implemented.

Assistance with these activities falls under our other DBA proposal model.

Free trial for 30 days

Talk to our specialists and see the evolution of monitoring in action.

Contact

Interested?
Let's talk

✉️
Commercial Email
[email protected]
📅
Schedule a Demo
Book via HubSpot

Fill in the form or contact our commercial team directly. We respond within 1 business day.

I want to know more about Power Alerts

class="modal-extras modal-video" data-video-src="https://www.youtube-nocookie.com/embed/uzN94F1dqEk?autoplay=1&origin=https://poweralerts.com.br">